Data Snapshot of Washtenaw Food Insecurity
Explore data related to food insecurity in Washtenaw County. Hover your mouse over each box below to learn more. Click here to see the full
Food Insecurity Dashboard.
Child Food Insecurity Rate
(Compared to MI Counties)
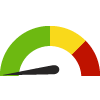
Food Environment Index
(Compared to MI Counties)
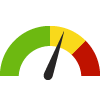
Food Insecurity Rate
(Compared to MI Counties)
People Living Below Poverty Level
(Compared to MI Counties)